This is an exceprt from my book Efficacious Educational Technology. It is available under a Creative Commons license. You can find a link to it inder the “Get Gary’s Books” menu above.
Educational researchers are almost always in search of interventions that will improve learning. When designing experiments to accomplish this, the changes made are called the independent variable and learning is the dependent variable. It is reasoned, “we can change instructional strategies independently” and “learning depends on the strategies we use.” (This makes perfect sense until we realize that measuring learning is very difficult, and what constitutes learning in one study is not measured in another.)
When we analyze experimental data (or any other quantitative data), we create scatter plots in which the independent variable is plotted in the x-axis and the dependent variable is plotted on the y-axis. Using this strategy, we can visualize how the two variables affect each other. We can see positive associations, which means that when the independent variable increases, the dependent one increases as well. We can also visualize negative associations, so that as the independent variable increases, the dependent variable decreases. We can also see when there is no effect between the variables.
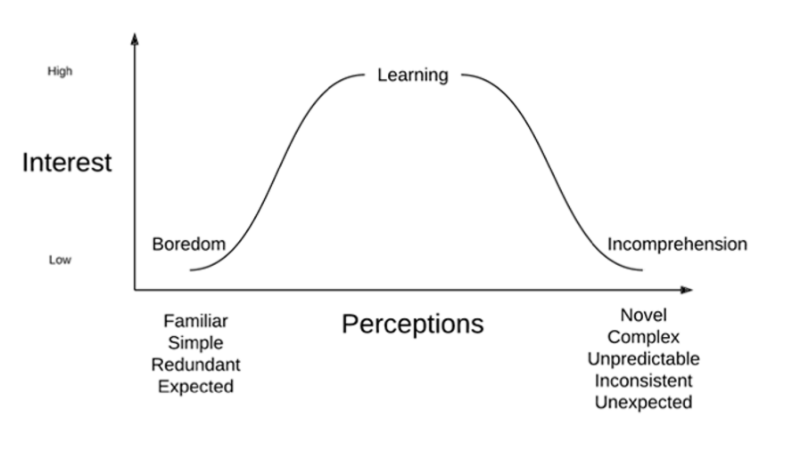
We can also use graphs to visualize qualitative data. On Figure 17, perceptions are the dependent variable, so they are displayed on the x-axis. Notice the data are qualitative, so different words describing students’ perceptions mark the extremes. Interest is the dependent variable, so the y axis shows low interest to high interest. The curve demonstrates how students’ interest changes according to their perceptions of the technology, media, or activities. When these are familiar, students are likely to be bored. When it is perceived to be too novel, students find it incomprehensible, so they have low interest. This graph suggests a moderate level of novelty (or complexity or unexpectedness) increases interest which leads to learning.
The left side of this curve, from boredom to novelty indicates a positive association between perceptions and interest. As students perceive moderate levels of novelty, interest increases. On the right side of the curve, we see a negative association between perceptions and interest; as things become too complex, interest decreases.
The theory illustrated in this graph demonstrates how theories affect our work. We know from this theory that some novelty in media and technology promotes learning, but it does not specify how much novelty is appropriate for any classroom setting or any individual student. We can predict from this theory that students with low interest in a lesson may be bored or it may be incomprehensible (Seels et al., 2004). It is educators’ job to decide which it is, and it is our job as educational technology professionals to support their efforts to make it more or less complex to seek to maximize interest, and hence, learning.
The relationship between interest and perceptions gives an example of the appropriate way IT professionals can ground decisions in theory without allowing it to interfere with our practice. A technology integration specialist who is familiar with the theory captured in Figure 17 may observe a classroom as they use technology and observe students’ lack of interest and suggest a change in how the technology is used to change students’ perceptions to adjust the level of novelty to be more appropriate. This change can be made without referencing the theory or explaining it other than with a simple statement to the teacher such as “I think the students may have been a little bored, let’s change things up a bit for the next class.”
Figure 17
Students’ Interest Versus Their Perceptions, adapted from Seels et al., 2004
In the preceding paragraph, we saw how IT professionals can change what they do using theory without specifying it. In other cases, they do want to be very explicit about how they use theory. We know that ease of use is positively associated with the intention to use technology (more about that later). Ease of use has been studied by researchers, and they have developed instruments (the term researchers to describe surveys) to measure it. IT leaders may want to measure ease of use over time to document how changes in their practice are affecting how people are using technology in the school. To do that, they would want to detail the theory they are using and the instrument as well as they conduct measurements.
When using theory—and the instruments that have been used to measure the variables—to make decisions, IT leaders can focus on the parts of their practice that matter. Using surveys to collect users’ opinions is a common way to gather data in schools (and in other organizations). If we use an appropriate instrument when we craft our surveys, we avoid collecting irrelevant data.
Reference
Seels, B., Fullerton, K., Berry, L., & Horn, L. (2004). Research on learning from television. In D. Jonassen (ed.), Handbook of Research on Educational Communications and Technology 2nd ed., (pp. 249-334). Lawrence Erlbaum Associates, Publishers.